Year 8 Maths Chapter 5 - Ratios and Rates
Table of Contents
Ratios
Ratios show a relationship between two (or more) related quantities, in the same unit and of the same type.
For example, a dead rabbit could have a ratio of fur to flesh, of 1:3. The colon (“:”) is used to represent ratios. A written ratio (a : b) is read as a to be or a is to b.
The order of the numbers in a ratio is important. 1:3 is not the same as 3:1.
Equivalent ratios can be formed, for example, by multiplying the ratio by the same amount. What you do to one side you must do to the other. 1:3, 2:6 and 10:30 are equivalent ratios.
Simplifying ratios can be done by dividing the ratio by the same amount, or multiplying if the ratio is not a whole number such as a fraction. You should attempt to express ratios in simplest forms.
Ratios must ALWAYS BE in the same unit.
The unitary method allows ratios to be shared into parts. For example, a ratio of 2:3 can be considered as 2 parts and 3 parts, and to divide a cost, for example, $20, can be divided into all five parts. Therefore, where 1 part is $4, 2 parts is $8 and 3 parts is $12. Hence, the ratio of 2:3 is $8:$12.
A scale drawing is a drawing which is identical to another except for its size. A scale drawing usually has a scale ratio. The scale ratio is written as Drawing (Scale) Length : Actual Length.
For example, a scale ratio of 1:100 is that the actual lengths are 100 times greater than the presented length.
A scale should begin with 1. Hence, the second number can be referred to as the scale factor.
To convert a SCALED distance to an ACTUAL distance you multiply by the scale factor, and vice versa.
Remember!
- 1 km = 1000 m (kilo means 1000, however, not necessarily true when it is raised to a power)
- 1 m = 100 cm
- 1 cm = 10 mm
Rates compare quantities of different units. All rates must include quantities.
The forward slash (“/”) is used to represent rates. Rates should be written in their simplest form; where the second quantity is only 1 unit (1 km, 1 minute).
The average rate is calculated by:
- Dividing the total amount of CHANGE in one quantity by the total amount of change in the second quantity.
- What you do to one side you must do to the other.
- For example, killing 400 rabbits in 4 days = 100 rabbits in 1 day.
The unitary method is:
- Finding the value of 1 unit
- Going back up to the required number of units
For example:
The ratio of dead rabbits to mutated pigs is 3:5. If there are 18 dead rabbits, how many mutated pigs are there?
To solve it, you would identify that 3 parts = 18 dead rabbits
Then, divide 18 by 3 to find 1 part
Therefore, 5 parts = 30 mutated pigs. Therefore, there are 30 mutated pigs.
Distance, Speed and Time
Distance, speed and time are important concepts for real life application of mathematics.
Terms you should know:
- Speed is a measure of how fast an object is travelling.
- Distance is a measure of how far an object has travelled (in this case).
- Time is a measure of how much indefinite continued progress of existence and events in the past, present, and future regarded as a whole has surpassed. Woah.
You can use two of the measures to find the third one. For example,
Where S is average speed, D is distance travelled and T is time lapsed…
S = D/T
The best way to remember the equations required is to use a DST triangle.
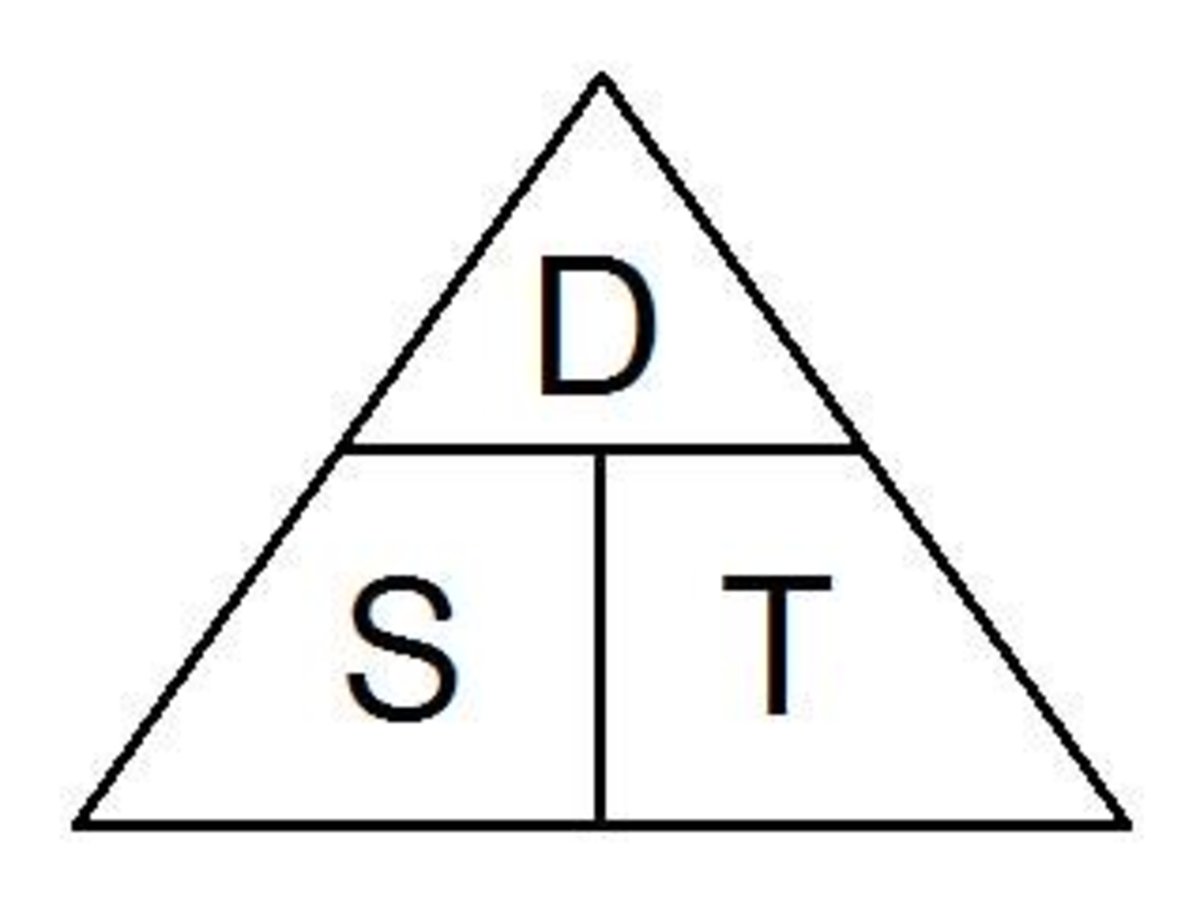
Where D is the numerator of a fraction in regards to S and T, and D is the product of the equation S x T.
So…
D = S x T
S = D/T
T = D/S
If the speed of an object does not change over time, then the object is travelling at a constant speed. For example, when a dead rabbit driving a Prius is using cruise control at 80 km/h, then the car has a constant speed of 80 km/h.
Units should also be the same when solving DST equations.
Distance and time graphs are used to show the distance on a vertical axis and the time taken on the horizontal axis, also known as the y and x axis respectively.
Each segment shows whether the object is moving or is stopped. The steepness of any one line segment shows the speed.
Steeper lines = faster speed
Look at this crappy D/T graph (note that D/T stands for distance/time, not design and technology)
